
Listen to the article
Ethereum continues to display choppy price action, remaining confined within a critical range as both buyers and sellers await a decisive breakout. Further consolidation is likely before a clear directional move takes shape.
Technical Analysis
By Shayan
The Daily Chart
On the daily timeframe, Ethereum’s consolidation phase has extended, with volatility and momentum both fading. Price action remains trapped within a crucial range defined by the 100-day moving average and the flag pattern’s upper boundary near $4.1K. This region represents a key supply zone that has repeatedly rejected upward attempts.
On the downside, the flag’s lower boundary, aligning with the $3.5K demand zone, acts as the primary support where buyers have consistently defended. Until a breakout occurs, Ethereum is expected to continue consolidating within this structure, absorbing order flow and building liquidity. A confirmed bullish breakout above $4.1K could likely trigger an impulsive rally toward a new all-time high (ATH).
The 4-Hour Chart
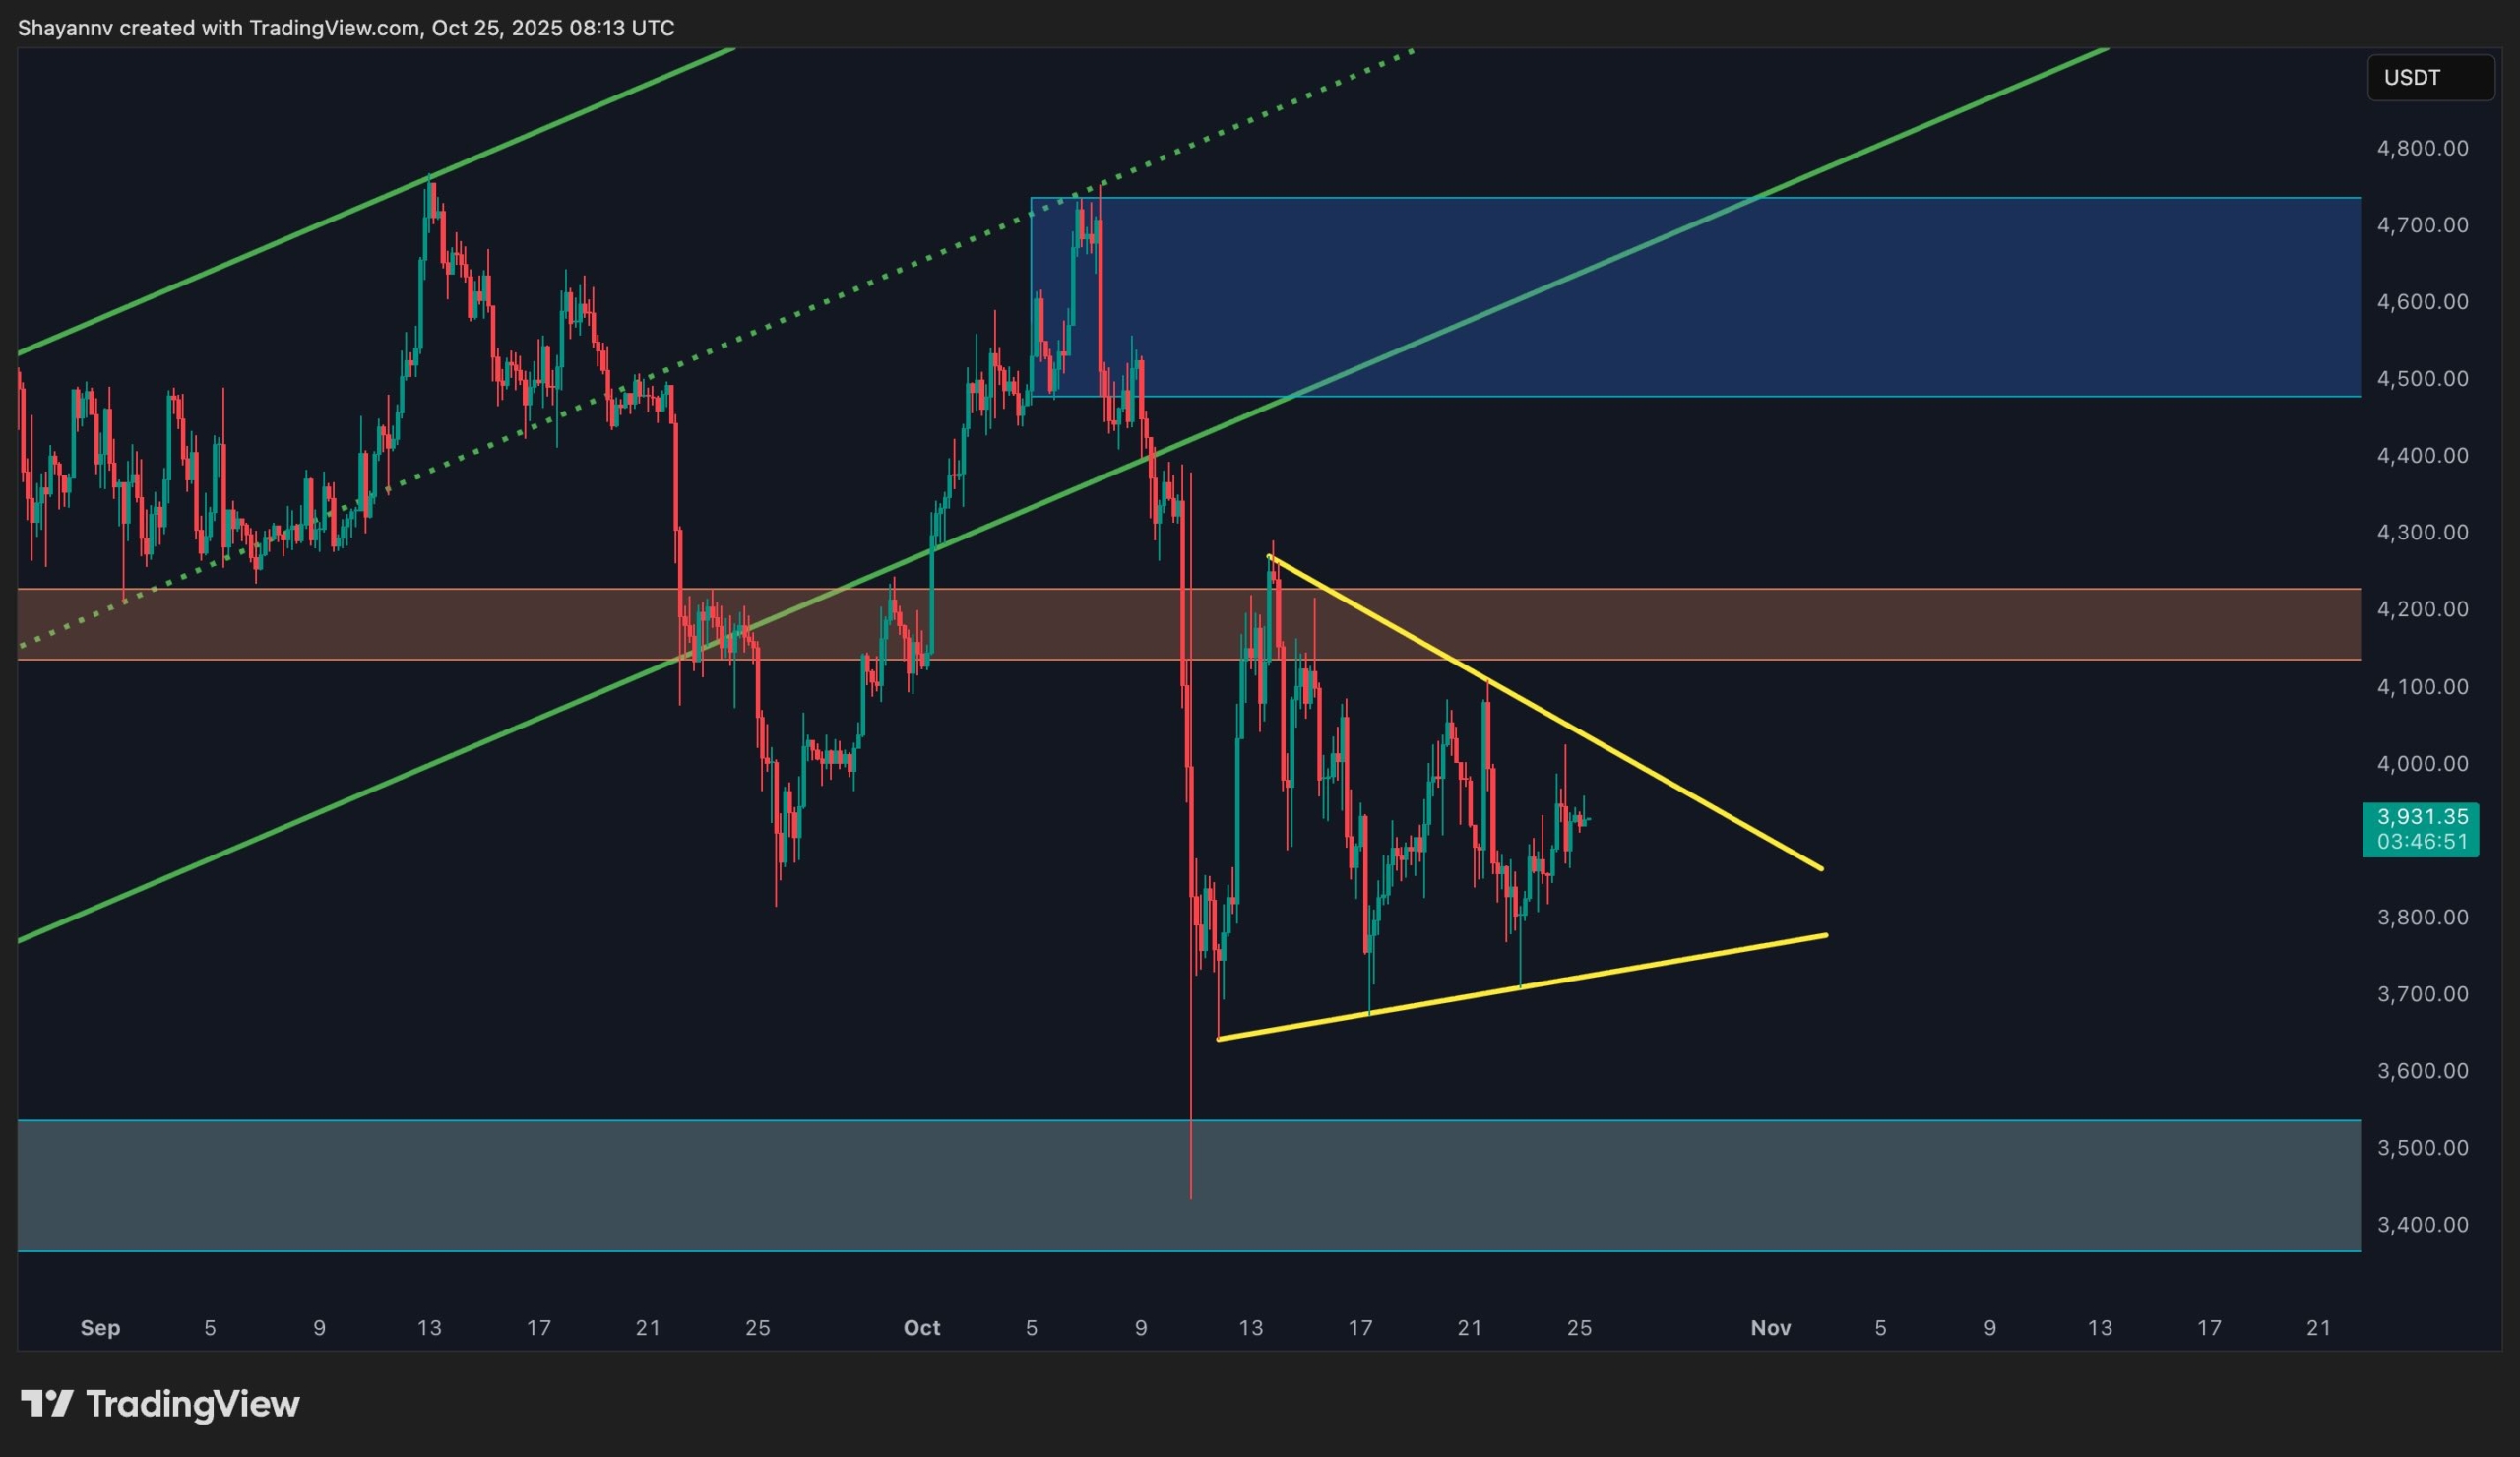
The 4-hour timeframe reveals Ethereum fluctuating inside a symmetrical triangle, reflecting ongoing market indecision and equilibrium between buyers and sellers. The asset is currently trading just below the triangle’s upper boundary near $4K, with momentum still insufficient for a confirmed breakout.
This compression pattern signals a liquidity buildup phase, where traders are positioning ahead of a potential volatility expansion. If bulls manage to push above the upper trendline, a rally toward $4.1K and potentially $4.6K could follow. Conversely, a breakdown below $3.7K would expose the $3.4K demand zone once again. Until confirmation, Ethereum is likely to continue oscillating within this narrowing range — a setup that typically precedes a sharp directional breakout.
Sentiment Analysis
By Shayan
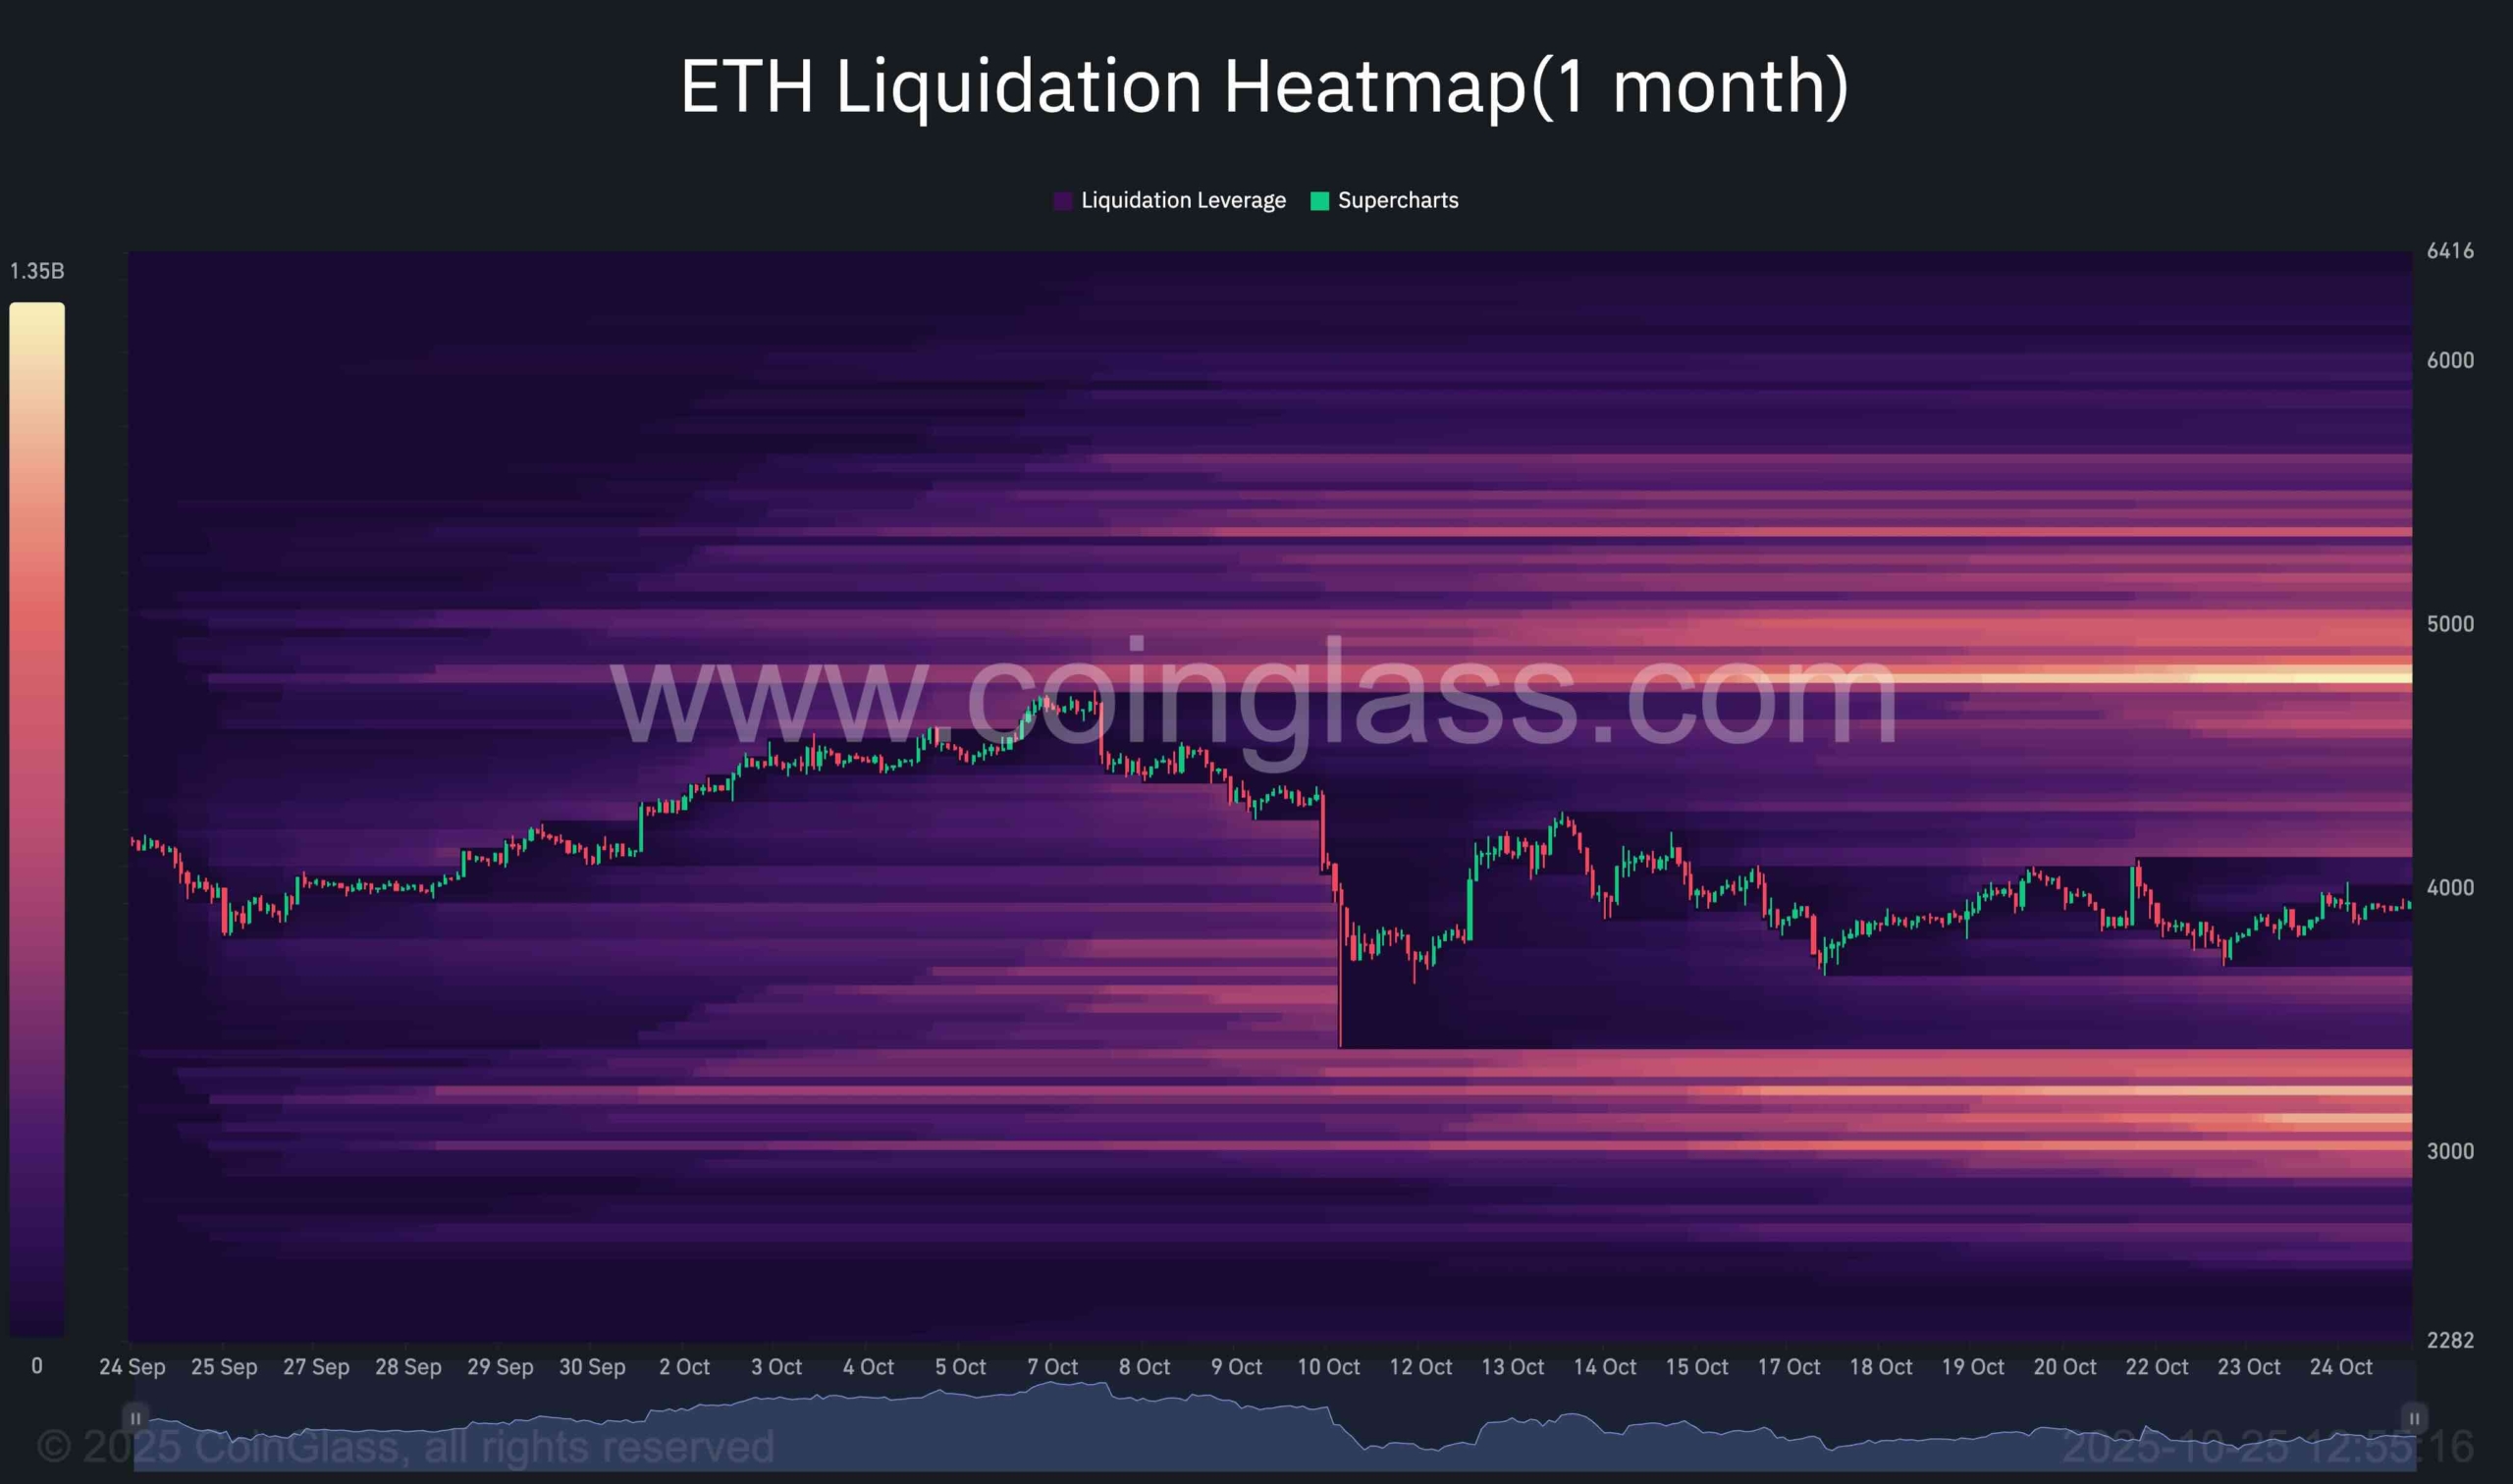
The 1-month liquidation heatmap for Ethereum reveals a dense liquidity pocket forming above the $4.8K swing high, situated directly beyond the current symmetrical consolidation structure. This area corresponds to a significant cluster of resting short liquidations, implying that if Ethereum reclaims the mid-range near $4.1K–$4.3K, a rapid move to absorb this overhead liquidity could follow.
Below the current price, the $3.5K range displays relatively weaker liquidation density, indicating that much of the downside liquidity was already cleared during last week’s sell-off, though a smaller residual cluster remains. This configuration reinforces the idea that Ethereum is likely to continue oscillating within its present consolidation range until one of these liquidity pockets is decisively tested.
Overall, the heatmap confirms that short-term volatility will remain concentrated within the $3.4K–$4.8K corridor, with the upper range carrying a slightly higher probability of being targeted first due to the larger liquidity concentration above current levels.